Data Reports Made Visual
Medeo helps you turn raw spreadsheets, KPIs, and analytics into visually engaging data videos. Instead of static charts or unreadable PDFs, present your insights as animated, dynamic, and easy-to-understand videos for executives, stakeholders, or social platforms.

What Is an AI Data Report Video Generator?
An AI Data Report Video Generator converts raw data—such as spreadsheets, KPIs, dashboards, and analytics—into animated video reports. Using AI, it visualizes key metrics, highlights trends, and explains insights through motion graphics and narration, making complex data easy to understand and share.
From Spreadsheets to Insightful Videos — In Minutes
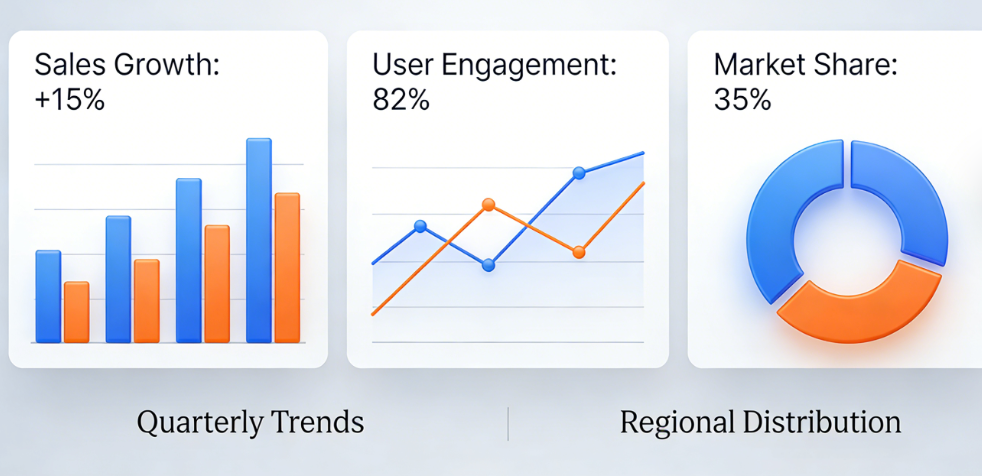
See your KPIs and analytics come alive with AI-powered data visualization
Before
Static spreadsheets, charts, or unreadable PDF reports
After
Animated data report videos with clear visuals and narration
Before
Static spreadsheets, charts, or unreadable PDF reports
After
Animated data report videos with clear visuals and narration
Reasons to Use Medeo for Data Report Videos
The smartest way to communicate insights with video
Simplify Complex Data
Turn spreadsheets, KPIs, and analytics into clear, animated videos that are easier to understand than static PDFs or slides.
Engage Stakeholders Better
Data storytelling in video format captures attention and improves retention. Whether for executives, clients, or teams, your reports will make a stronger impact compared to traditional charts.
Share Anywhere with Ease
Export your data report videos in multiple formats optimized for presentations, LinkedIn, YouTube, or internal dashboards, making distribution effortless and professional.
Instant Data-to-Video Conversion
Turn spreadsheets and analytics into polished videos in minutes.
Clear KPI Visualization
AI automatically highlights key metrics, trends, and performance changes.
Executive-Friendly Format
Present insights in a concise, visual format executives can grasp quickly.
Data Report to Video
Turn analytics and reports into compelling visual stories
Interactive Presentation Styles
Choose between business report, dashboard summary, or research briefing formats.
Custom Narration & Subtitles
Add AI voiceovers or captions to explain your insights clearly and professionally.
AI Data Visualization Generator
Automatically transform raw reports into animated charts, graphs, and infographics.
How to Create Data Report Videos with Medeo?
Step 1
Step 1: Upload Your Data
Paste your report summary, upload spreadsheets, or describe the metrics you want to visualize.
Step 2
Step 2: Select Visualization Style
Choose bar charts, pie charts, trend lines, or animated dashboards.
Step 3
Step 3: Add Narration & Effects
Use AI voices, subtitles, or branded design elements to enhance clarity.
Step 4
Step 4: Export & Share
Generate your video in high-quality formats, ready for presentations or social media.
FAQs
Which platforms support Medeo’s data report videos?
You can export videos optimized for business meetings, LinkedIn, YouTube, TikTok, or any platform that accepts MP4.
Can I brand my data videos with logos and colors?
Yes. You can customize your videos with brand colors, logos, and typography to align with your company identity.
Does Medeo support financial and business analytics reports?
Absolutely. From quarterly earnings to sales dashboards, Medeo creates professional business analytics videos.
Can Medeo turn Excel spreadsheets into videos?
Yes. You can upload summaries or describe your data, and Medeo generates animated data report videos instantly.